
What is sustainability?
Why the Ecological footprint?
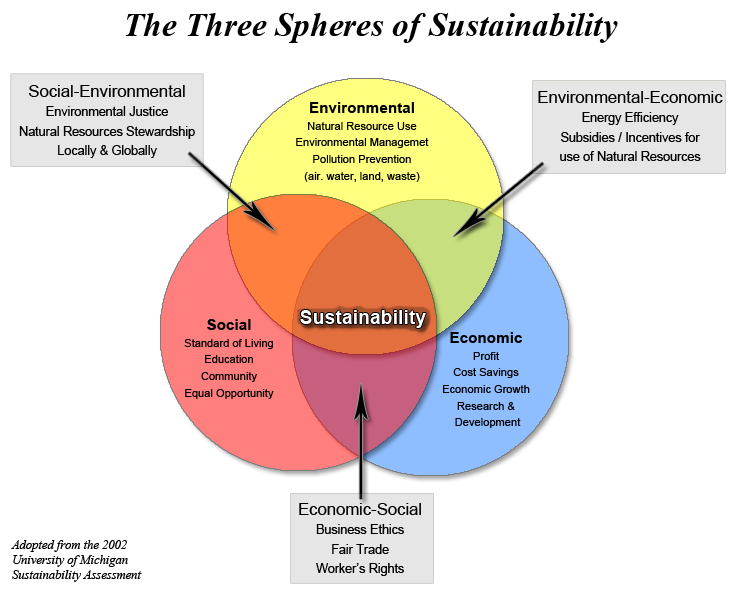
It is an environmental sustainability indicator, which expresses the relationship between humans and the natural environment. So one of its most powerful uses is in the assessment of sustainability and by comparing the ecological footprint (demand) with biocapacity (supply) it is possible to assess ecological/environmental sustainability. QUESTION: Using the diagram below, can you name the components that are used in calculating the eco-footprint?
Below is an interesting way of using a map visual to show and compare the ecological footprint of different countries around the Globe using 2008 data…
 WWF’s annual Living Planet Report – is a massive doc, but lots and lots of good very relevant and up-to-date info for this whole unit. Living Planet Report_2012_WWF. Browse it! You will find nearly every countries Earth Share (gha per capita) and biocapacity. Humans can exceed their local carrying capacity in several ways including trade to import resources. Thus human carrying capacity can be viewed as the maximum load (rate of resource harvesting and waste generation) that can be sustained indefinitely without reducing productivity and functioning of ecosystems wherever those ecosystems are. Thus, the human carrying capacity depends not only on population size but also on the areas of land that support that population. Two researchers in Canada, Rees and Wackernagel (cool name!), first published a book on ecological footprints and their calculations in 1996. The Since then, the concept has become widely accepted with many website calculators designed to help you measure your own eco-footprint.
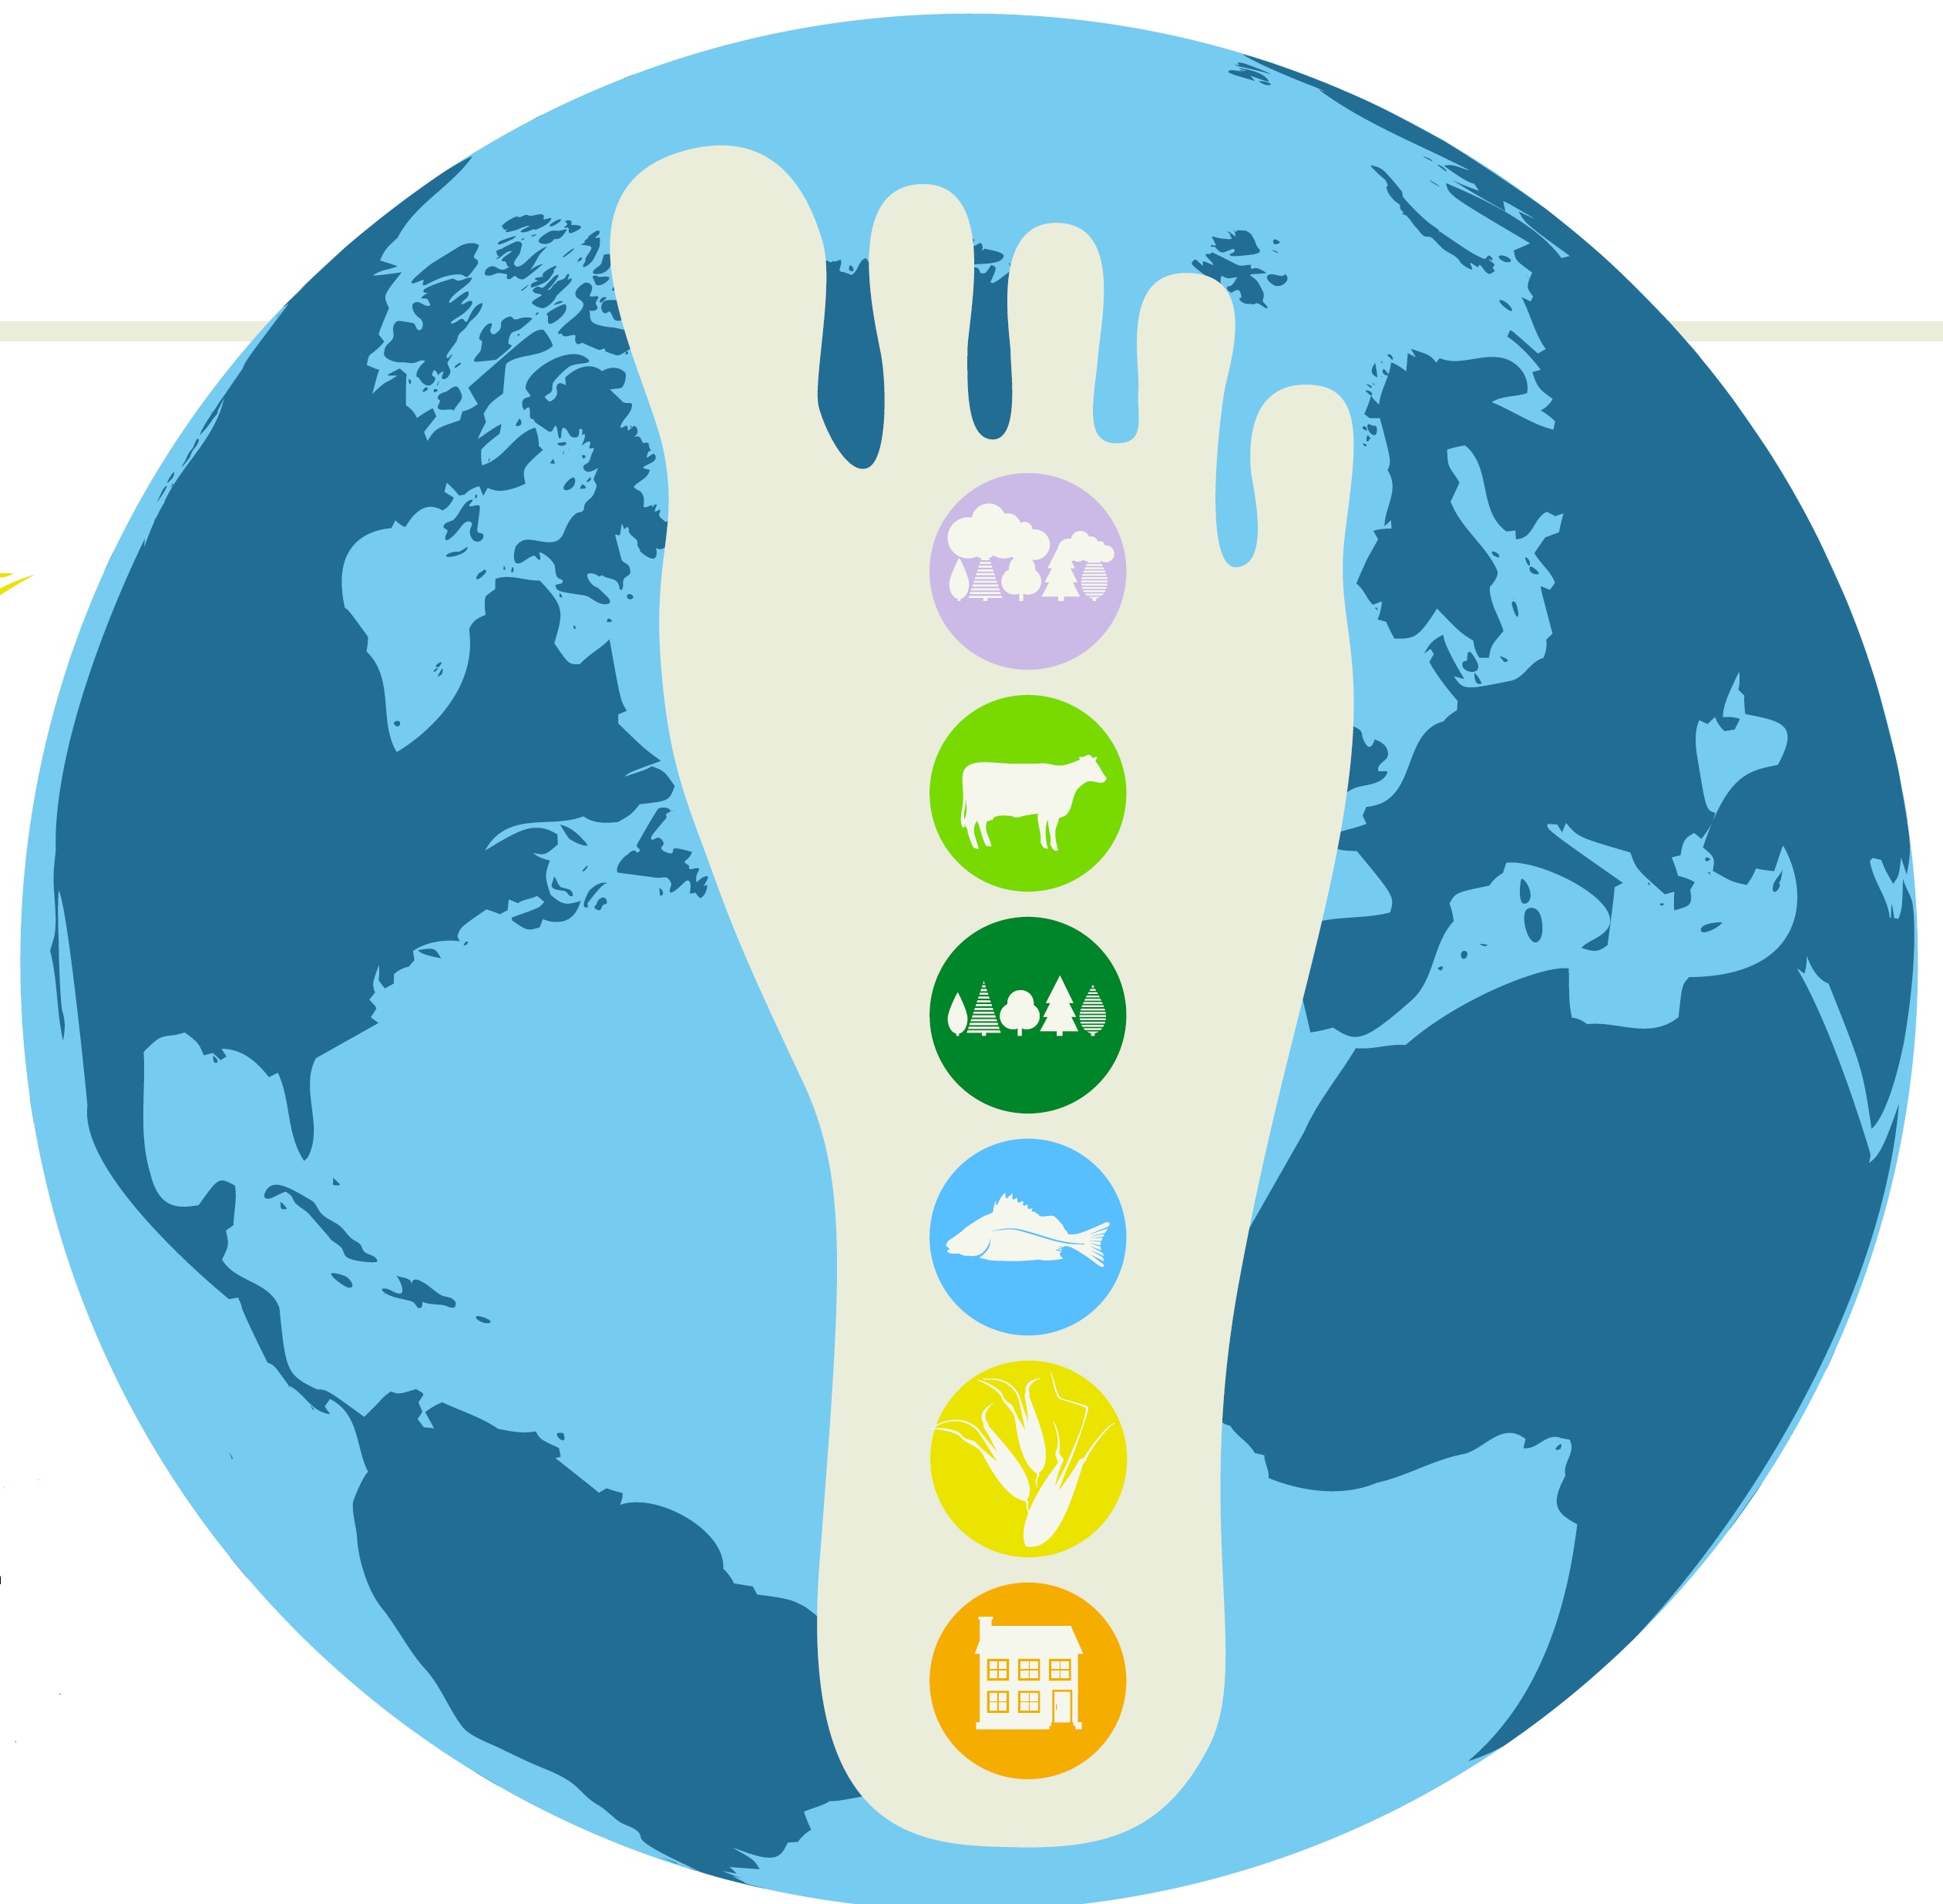
What is your ecological shoe size?

Calculate your eco-footprint here! One of many online eco-foot calculators.
Here’s a slightly outdated document with some useful information, nonetheless it can help you to make comparisons over time – EcoFootprints Class notes – T3.7_8 EcoFoot & K
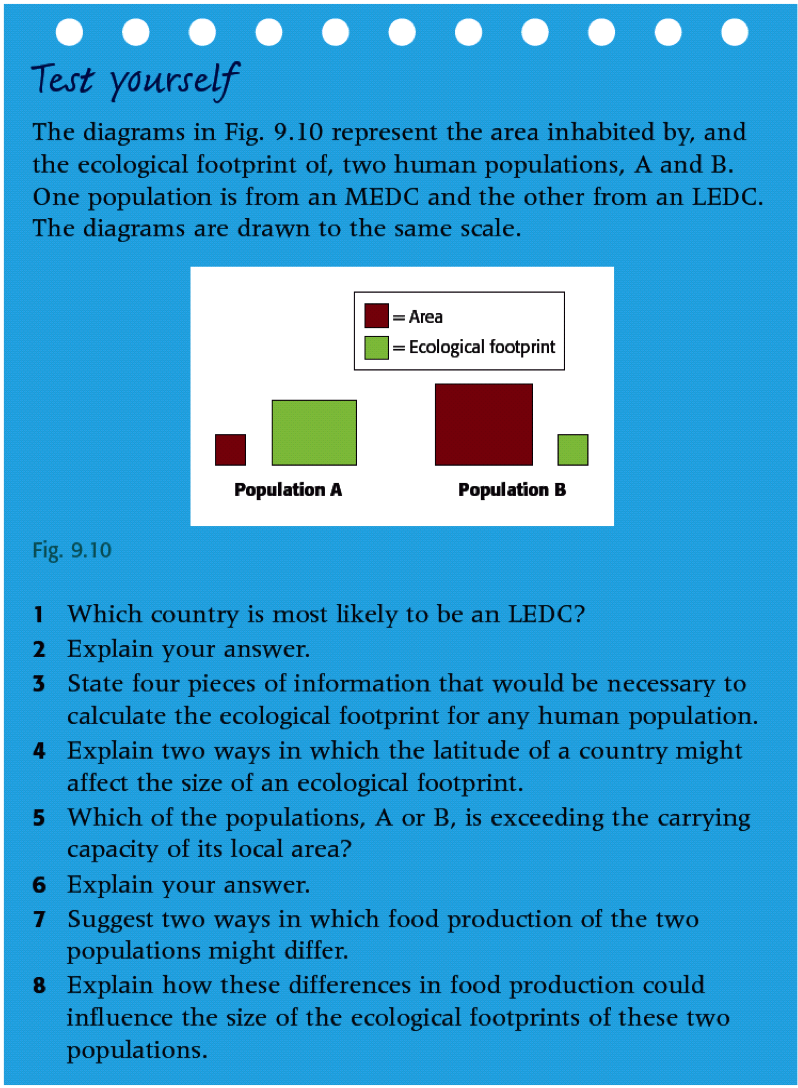
TASK: Describe and explain the differences between the ecological footprints of two human populations, one from an LEDC (choose) and one from an MEDC (Denmark). Here’s a web link to help you get started.
 Click on the headline for a news article on Denmark’s ecological footprint.
source: Jill Rutherford – ESS Course Companion
")
